
Most help desks have no shortage of metrics anymore: ticket counts, response times, satisfaction scores, resolution rates and countless charts are only ever a click away. Yet answering a simple question like:
“What actually deserves my attention today?”
often means jumping between multiple reports, filtering data several different ways and opening dozens of conversations. The picture eventually comes together, but the frustrating part is how much manual work it takes before it does.
That’s exactly what Konrado.AI changes by means of Insights. Rather than giving you another analytics page filled with numbers to interpret yourself, it connects the metrics with the conversations behind them. You see what’s changing, why it’s changing, and, perhaps most importantly, you can jump straight into the tickets responsible for every trend you see.
Overview: Connecting the dots
The Overview page focuses on the handful of questions people naturally ask when they start their day. How many new tickets arrived? How many were resolved? Are customers waiting longer than usual for a first response? Is the queue growing or shrinking compared to last week?
Those numbers come with trends from the previous period, which immediately gives them context. Five hundred open tickets can be perfectly healthy for one organization and a warning sign for another. What matters is whether things are moving in the right direction.
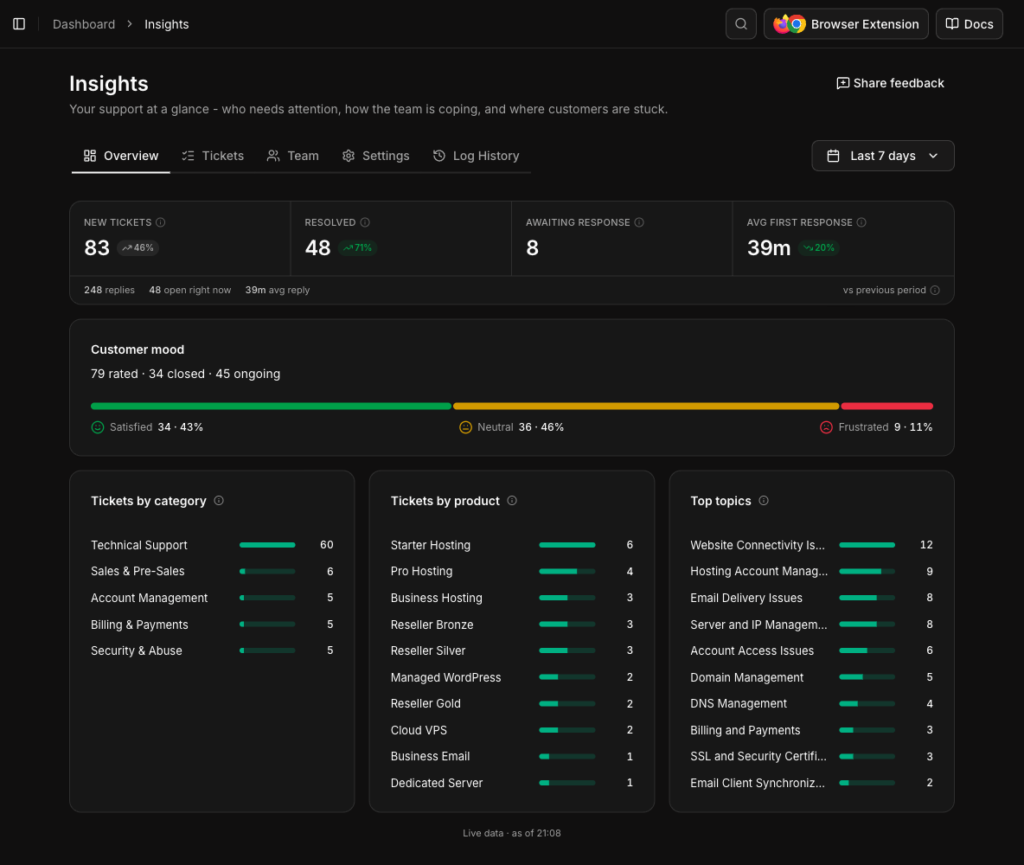
From there, Insights gradually widens the picture. Customer satisfaction is broken down into satisfied, neutral and frustrated conversations, making it easy to notice changes in sentiment without digging through individual survey responses. Products, categories and automatically detected topics reveal where customers are spending most of your team’s time, often highlighting patterns that would otherwise stay hidden until someone happened to notice them manually.
Worth knowing
Every figure inside Insights is built from real support conversations, and every figure can take you back to those conversations. If ticket volume suddenly increases, you can immediately open the exact tickets behind that number. If customer satisfaction drops, you can see precisely which conversations contributed to it. The dashboard never asks you to simply trust the summary, because you can always verify it yourself.
Tickets: Following the numbers back to the conversation
Every drill-down inside Insights takes you to the Tickets view with the relevant filters already applied, so instead of manually rebuilding searches, you’re immediately looking at the conversations behind the metric.
Scanning those conversations is noticeably easier than in a traditional inbox. Each ticket receives an AI-generated subject that replaces the familiar collection of “Re: Re: Fwd:” email chains, together with a concise summary explaining what the discussion is genuinely about.
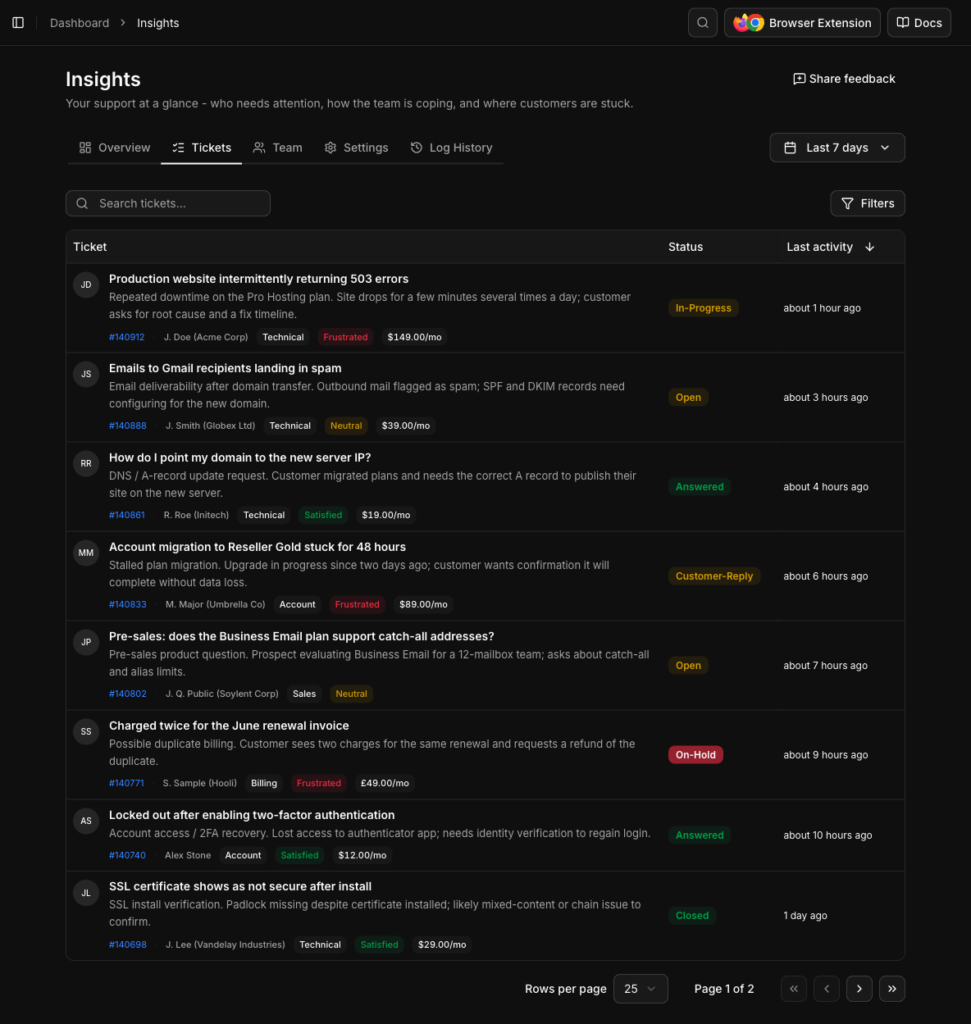
Alongside that, you can see the customer, their company, their monthly spend, customer satisfaction with the reasoning behind the score, and all the filters you’d expect, from products and topics to assigned agents, ticket status or conversations still waiting for a reply.
The result is less time spent figuring out which tickets deserve your attention and more time understanding the situations behind them.
Topics: Maintenance not required
You can start with the most carefully planned categories, but as the business grows and new products appear, it’s only a matter of time before half the conversations end up under “Other” because nobody can quite decide where they belong. Insights avoids that problem by removing the need for manually maintained taxonomies.
Konrado.AI identifies the topic of every incoming conversation automatically. Similar language naturally collapses into broader themes specific to your organization, so tickets mentioning nameservers, DNS records or zone configuration become part of the same discussion without anyone having to define those relationships beforehand.
You see what customers are actually contacting you about, without being limited by a category structure that may no longer reflect reality.
Team: Every contributor counts
Support performance has always been difficult to evaluate fairly. Closing the most tickets doesn’t necessarily mean providing the best support, just as responding quickly isn’t especially impressive if customers leave frustrated after every interaction. Looking at a single metric almost always rewards the wrong behavior.
The Team view brings those different dimensions together. You can see how work is distributed across the team, how quickly individual agents respond, how many replies they’re sending, how many tickets they’re handling and how satisfied customers are after those conversations.
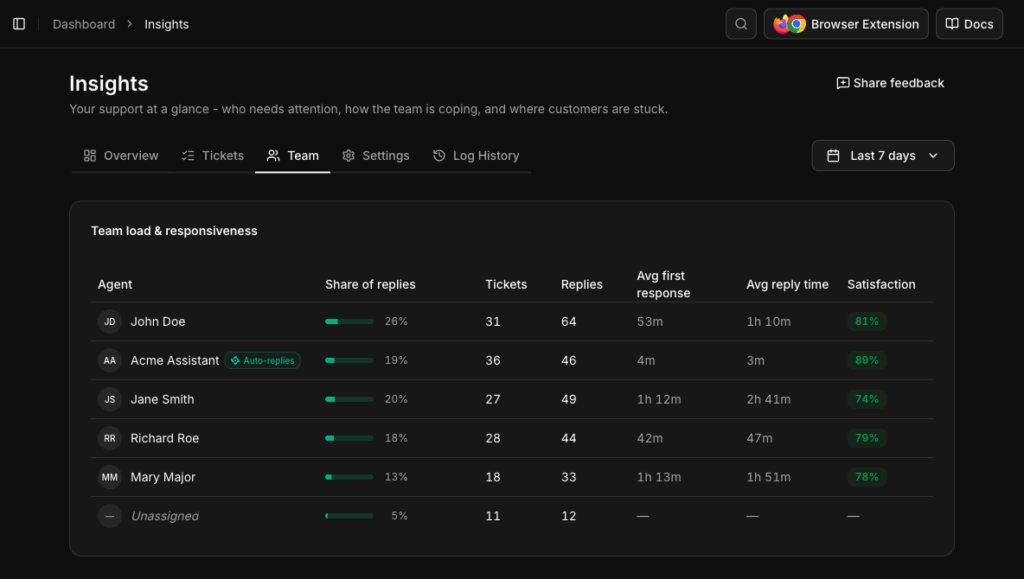
Then there’s one more participant on the list. Konrado’s automatic replies are measured separately, making it easy to see exactly how much work AI is handling and how customers respond to those interactions. That means you’re looking at measurable results generated by your own support queue rather than estimates or assumptions. And for teams investing in automation, that’s often the most convincing evidence they can get.
Email summaries: The fastest way to catch up
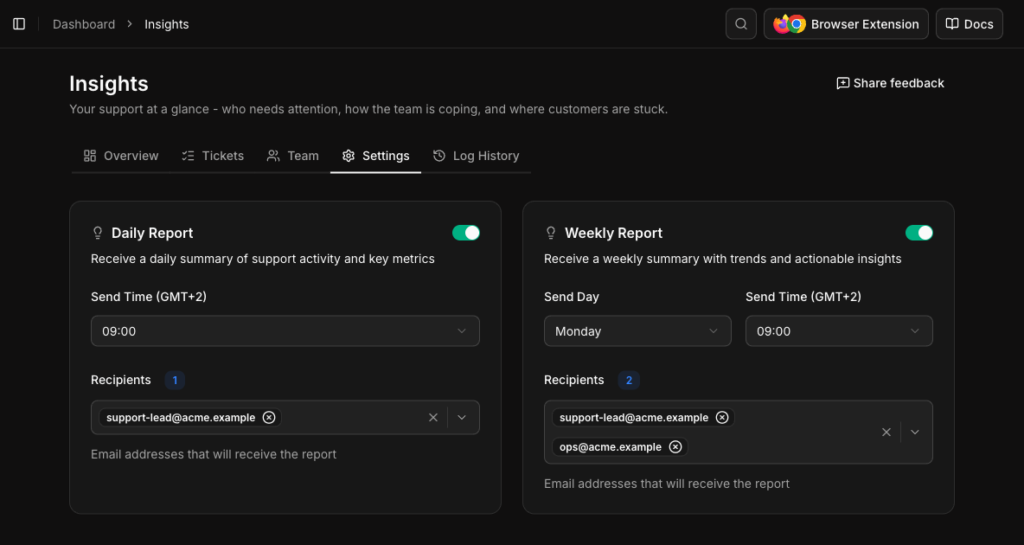
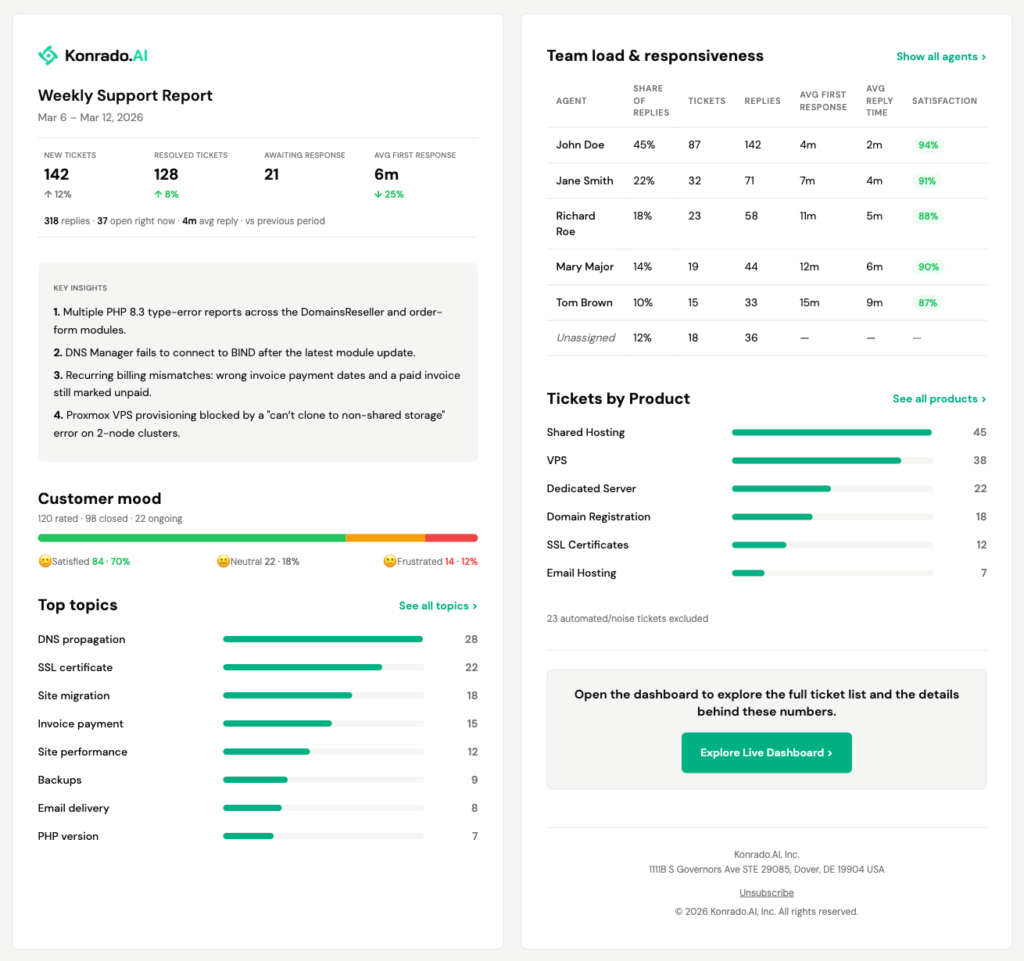
Relying on people to remember yet another dashboard simply doesn’t work all that well. By the time they get around to opening it, the day has usually moved on. That’s why Insights sends a daily or weekly summary straight to your inbox. You decide who receives it, when it arrives and how often it’s sent.
The email itself is intentionally light on words and heavy on useful signals. In less than a minute you can see how ticket volume changed, how quickly the team responded, how clients felt about recent conversations, which products generated the most activity and which topics appeared most often during the reporting period.
AI Key Insights
This section is worth a closer look because it identifies meaningful patterns emerging across conversations. Perhaps a recent batch of domain migrations resulted in a noticeable increase in SPF and DKIM questions. Maybe a product update reduced one category of tickets while creating another. The goal isn’t to rephrase statistics in complete sentences, but to point out relationships that aren’t immediately obvious when you’re looking at the numbers alone.
Already included, already working
If you’re already using Konrado.AI, there’s nothing extra to buy or set up. Insights is included in your existing plan at no additional cost, and your first summary email has already arrived automatically. From there, you can explore the full dashboard whenever you want to dig deeper into what’s happening across your support operation.
The best way to get familiar with Insights? Start using it! And whenever you need a closer look at a particular feature, dashboard view or configuration option, you’ll find detailed guidance in the Insights documentation.

Write a Reply